Originally Posted By: larrOriginally Posted By: jeffoOriginally Posted By: NM LeonQuote:You really don't have a clue, do you? Talk a good game though. Most cult leaders do.
Typical liberal/Alinsky BS. When you can't refute the facts given by your opponant in a debate, attempt to demean him personally.
Quote:jeffo, once again. wisconsin 44th
http://education.usnews.rankingsandrevie...tate-statistics
Quote:Can you explain what all this means? Didn't think so
Yeah jeffo, I know these computer thingies can be confusing, but if you had followed the link given and then worked up the tree from the table to the article and then to "methodology", you would have found this:
The 2010 U.S.News & World Report Americas Best High Schools methodology, developed by School Evaluation Services, a K-12 education data research business run by Standard & Poor's, is based on the key principles that a great high school must serve all its students well, not just those who are collegebound, and that it must be able to produce measurable academic outcomes to show the school is successfully educating its student body across a range of performance indicators.
We analyzed 21,786 public high schools in 48 states plus the District of Columbia. This is the total number of public high schools that had 12th-grade enrollment and sufficient data, primarily from the 2007-2008 school year, to analyze. (Nebraska and Oklahoma did not provide full data. Their schools were evaluated for honorable mention, but none met the criteria.)
A three-step process determined the best high schools. The first two steps ensured that the schools serve all their students well, using state proficiency standards as the benchmarks. For those schools that made it past the first two steps, a third step assessed the degree to which schools prepare students for college-level work.
Test performance. The first step determined whether each school's students were performing better than statistically expected for the average student in the state. We started by looking at reading and math results for all students on each state's high school test. We then factored in the percentage of economically disadvantaged students (who tend to score lower) enrolled at the school to identify the schools that were performing better than statistical expectations.
For those schools that made it past this first step, the second step determined whether the school's least-advantaged students (black, Hispanic, and low income) were performing better than average for similar students in the state. We compared each school's math and reading proficiency rates for disadvantaged students with the statewide results for these student groups and then selected schools that were performing better than this state average.
Schools that made it through the first two steps became eligible to be judged nationally on the final step, college-readiness performance, using Advanced Placement and International Baccalaureate test data as the benchmarks for success, depending on which program was largest at the school. AP is a College Board program that offers college-level courses at high schools across the country. The International Baccalaureate program also offers a college-level curriculum. This third step measured which schools produced the best college-level achievement for the highest percentages of their students. This was done by computing a "college readiness index" based on the school's AP or IB participation rate (the number of 12th-grade students who took at least one AP or IB test before or during their senior year, divided by the number of 12th graders) and how well the students did on those tests. The latter part, called quality-adjusted AP or IB participation, is the number of 12th-grade students who took and passed (received an AP score of 3 or higher or an IB score of 4 or higher) at least one of the tests before or during their senior year, divided by the number of 12th graders at that school. For the college readiness index, the quality-adjusted participation rate was weighted 75 percent in the calculation, and 25 percent of the weight was placed on the simple AP or IB participation rate. Only schools that had values greater than 20 in their college readiness index scored high enough to meet this criterion for gold and silver medal selection. The minimum of 20 was used because it represents what it would take to have a "critical mass" of students gaining access to college-level coursework.
The top 100 high schools nationwide with the highest college readiness index scores were ranked numerically (ties were broken using first the participant passing rate and then the average number of AP and/or IB exams passed per test taker) and awarded gold medals. The next 461 top-performing high schools nationwide—based on their college readiness index scores—earned silver medals. An additional 1,189 high schools in 48 states plus the District of Columbia that passed the first two steps were awarded bronze medals. Thirty-seven more high schools in 12 states received an honorable mention medal if they would have scored high enough on the college readiness index to earn a gold medal but didn't fully meet Step 1 and Step 2.
Analysts from School Evaluation Services developed the methodology and compiled the analysis. AP is a trademark owned by the College Board, which was not involved in the production of and does not endorse this product.
That is as opposed to your table of SAT scores where WI ranked fourth.
Let me explain this in as simple terms as I can.
In the table you provided, the only data points were WI 12 graders who took the SAT test. It did not include 12 graders who did NOT take the test, did not include the freshmen, sophomores, and juniors who had dropped out before their senior year, did not include anything at all about the percentage of 8th graders from 4 years before who took the test, did not adjust for racial, special needs, or disadvantaged students, etc.
Your table didn't rate schools at all, only the subset of 12 graders who took the ACT exams compared to 12 graders from other states who took the ACTs (but not SATs).
The US News study didn't rate students at all, it rated schools based on the criteria above.
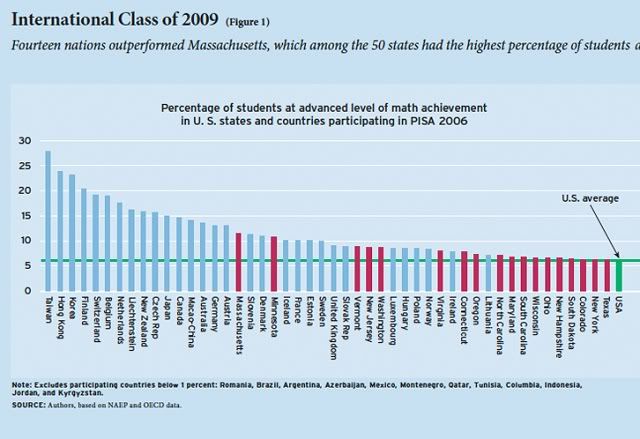
Here's how WI rates in math scores compared to other states and countries.
Top SAT State Scores include Iowa, Wisconsin, Minnesota and Missouri. These States primarily have their students take the ACT test so their numbers may not be representative of the entire state.
The Worst States for SAT Scores include Maine, Hawaii, South Carolina, Georgia and New York. DC is also very low.
Here is the ranking of SAT Scores by State List:
2009 State Sat Scores
Rate Reading Math Writing Total
1 Iowa 3% 610 615 588 1813
2 Wisconsin 5% 594 608 582 1784 3 Minnesota 7% 595 609 578 1782
4 Missouri 5% 595 600 584 1779
5 Illinois 6% 588 604 583 1775
6 Michigan 5% 584 603 575 1762
7 South Dakota 3% 589 600 569 1758
8 Nebraska 4% 587 594 572 1753
9 North Dakota 3% 590 593 566 1749
10 Kansas 7% 581 589 564 1734
11 Kentucky 7% 573 573 561 1707
12 Oklahoma 5% 575 571 557 1703
13 Tennessee 10% 571 565 565 1701
14 Arkansas 5% 572 572 556 1700
15 Colorado 20% 568 575 555 1698
16 Wyoming 5% 567 568 550 1685
17 Mississippi 4% 567 554 559 1680
18 Louisiana 7% 563 558 555 1676
19 Alabama 7% 557 552 549 1658
20 Utah 6% 559 558 540 1657
21 New Mexico 11% 553 546 534 1633
22 Ohio 22% 537 546 523 1606
23 Montana 22% 541 542 519 1602
24 Idaho 18% 541 540 520 1601
25 Washington 53% 524 531 507 1563
26 New Hampshire 75% 523 523 510 1557
27 Massachusetts 84% 514 526 510 1551
28 Oregon 52% 523 525 499 1548
29 Vermont 64% 518 518 506 1543
30 Connecticut 83% 509 513 512 1535
31 Arizona 26% 516 521 497 1534
32 Alaska 46% 520 516 492 1528
33 Virginia 68% 511 512 498 1522
34 California 49% 500 513 498 1511
35 West Virginia 18% 511 501 499 1511
36 New Jersey 76% 496 513 496 1506
37 Maryland 69% 500 502 495 1498
38 Rhode Island 66% 498 496 494 1489
39 North Carolina 63% 495 511 480 1487
40 Nevada 42% 501 505 479 1485
41 Indiana 63% 496 507 480 1484
42 Delaware 71% 495 498 484 1478
43 Pennsylvania 71% 493 501 483 1478
44 Florida 59% 497 498 480 1476
45 Texas 51% 486 506 475 1468
46 New York 85% 485 502 478 1466
47 Georgia 71% 490 491 479 1461
48 South Carolina 67% 486 496 470 1453
49 Hawaii 58% 479 502 469 1451
50 Maine 90% 468 467 455 1391
51 DC 79% 466 451 461 1379
All Students 46% 501 515 493 1509
Source: College Board and various news services Rate: Student Population Rate as reported by
www.collegeboard.com
i come to the conclusion that it wont matter what facts you show a liberal its their way or no way,it must be terrible to have facts staring you in the eyes and cant understand them. it wont matter what you show or tell jeffo he's right your wrong,thats the liberal way. i work with a few liberals and its the same,you can tell them the sun is shining and they will tell you its raining. take them outside and blind them with the sun and they still say its raining.sadly i think they actually believe its raining in their mind.
I posted a fact showing Wisconsin in #2 in SAT scores. That's a fact. Right there. A fact. Why is that fact ignored? Leads me to believe you and others are not so much interested in facts as you are in whining about your crappy place in life. You are what you choose to be. If you choose to be stupid, that's you choice also. And making blanket statements about liberals shows a decided lack of perspective and a gross ignorance. By the way, I'm not a Democrat nor a liberal. I think for myself. Try it.


 So, does than leave Republican, Independent, and Athiest? Just asking! What?